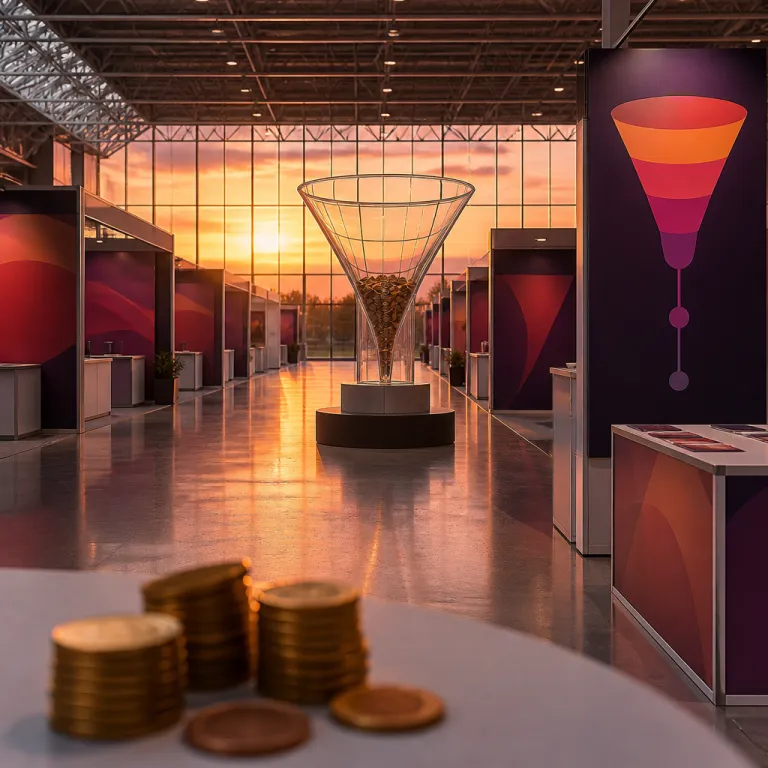
From badge scans to pipeline: redefining trade show ROI in the Netherlands
At the RAI Amsterdam or Jaarbeurs Utrecht, most exhibitors still report trade show ROI using badge scans and anecdotal booth buzz. Dutch B2B teams that treat each event as a measurable commercial investment instead calculate total show ROI as pipeline value per euro of total investment, over a realistic sales cycle of 90 to 180 days. That shift from activity to outcomes is where a show stops being a cost centre and starts behaving like a repeatable revenue channel.
For a typical Dutch exhibitor investing around 40 000 euros per trade show, based on aggregated budgets from Benelux field marketing surveys and venue cost calculators, the real question is not how many leads the équipe scanned but how much qualified pipeline the exhibit sourced or influenced. The working formula is simple on paper: trade show ROI equals attributed pipeline value divided by total investment, where total investment includes show cost, booth design, travel, pre show campaigns, on site staffing, and post show follow up. The complexity sits in measuring trade impact accurately across long B2B sales cycles and separating sourced revenue from influenced revenue in your CRM, using consistent attribution rules rather than one off estimates.
Global benchmarks are often quoted as USD 4 returned for every USD 1 spent, with well executed programmes reaching more than USD 20 per USD 1, drawing on long running event marketing studies and vendor case reports. Yet Dutch field marketing managers know that such headline ROI trade numbers hide wide variance by industry, deal size, and sales cycles. In Benelux enterprise software, a strong pipeline ROI benchmark is usually three to five times return investment on total show investment, while anything below one and a half times often signals structural issues in lead qualification or post show execution. Internal analyses of Dutch teams, combining CRM exports and finance data, show that around 70 percent of exhibitors still struggle to quantify show ROI at all, which means the competitive edge now lies in measurement discipline rather than bigger booths.
The ROI formula Dutch CFOs actually trust
When a Dutch CFO asks for trade show ROI, they are not asking for a colourful post show report with photos of a crowded booth. They want a clear reconciliation between total investment and measurable commercial outcomes, expressed in metrics that align with how they evaluate any other capital allocation decision. That means your event narrative must move from lead volume and brand awareness anecdotes to hard numbers on cost per qualified lead, pipeline velocity, and win rate shifts.
The baseline formula most Dutch exhibitors now adopt is straightforward: trade show ROI equals attributed pipeline value divided by total show cost, where attributed pipeline value includes both sourced opportunities and influenced deals that progressed materially after the event. To make this credible, you need CRM campaign structures that tag every show lead, lead disposition codes that distinguish marketing qualified leads from sales accepted opportunities, and attribution windows that reflect your typical sales cycles of around 90 to 180 days. Measuring trade impact only in the first two weeks after an event almost always underestimates long term value, especially for complex deals involving multi person buying committees.
For a Benelux cybersecurity vendor at Infosecurity Netherlands, a realistic CFO ready view might show 40 000 euros of total investment, 350 show leads captured, 120 qualified leads accepted by sales, and 12 opportunities opened within 60 days, with an expected pipeline value of 600 000 euros. That yields a pipeline show ROI of 15 times on paper. A prudent finance leader will then ask how many of those opportunities close and at what win rate compared with non event sourced deals, and will want to see the same formula applied consistently across events. To support that conversation, many Dutch teams now use a 6 to 12 month measurement window and rely on structured post show follow up playbooks such as those outlined in specialised Dutch exhibitor resources on accelerating badge scans into qualified pipeline within the first 48 hours.
Cost, booth design, and the real economics of exhibiting in Dutch venues
Most trade show debates in Dutch marketing teams still start with booth design mood boards rather than a hard look at cost per qualified lead. At the RAI, a 24 square metre corner booth in a mainstream technology hall can easily push your total investment above 50 000 euros once you add show cost, stand build, AV, hospitality, travel, and pre show campaigns. Without a disciplined measurement framework, that spend becomes a sunk cost justified by vague claims about brand awareness and relationship building.
The economics change when you treat each exhibit as a micro profit and loss statement, where booth traffic is a means to an end rather than the KPI itself. A Dutch industrial automation exhibitor at Rotterdam Ahoy recently modelled that with a 45 000 euro show investment and an average cost per lead of around USD 112, drawn from blended internal data and global event benchmarks, they needed at least 400 qualified leads to hit a three times pipeline ROI benchmark, assuming a conservative conversion rate into opportunities. When they compared this with field sales calls costing more than double per lead, at roughly USD 259 according to comparative channel studies, the trade show still looked attractive, but only because they had robust post show processes to convert show leads into real deals.
For senior field marketing managers, the practical implication is clear: negotiate sponsorships and booth packages backwards from a target cost per qualified lead and a desired ROI trade multiple, not forwards from what the organiser proposes. Detailed analyses of the real cost of exhibiting in Dutch venues show how easily catering, rigging, and last minute upgrades inflate total show cost without moving the needle on pipeline. A CFO will accept a higher total investment if you can demonstrate that incremental spend on meeting rooms or hosted buyer programmes shortens sales cycles or lifts win rates, but they will push back hard on aesthetic upgrades that only increase vanity metrics.
Lead management infrastructure: from booth traffic to qualified pipeline
The single biggest reason Dutch trade show programmes underperform is not weak booth traffic but broken lead management infrastructure. Teams obsess over the exhibit location and the coffee machine while neglecting the CRM plumbing that turns raw leads into qualified leads and, eventually, revenue. In practice, that means badge scanners full of unstructured data, no standard lead qualification criteria, and sales teams that treat post show lists as low priority.
A high performing Dutch exhibitor now designs the entire event journey around lead quality, not just lead volume, starting with pre show targeting and ending with disciplined post show follow up. At a logistics technology show in Utrecht, one Benelux scale up used intent data to pre qualify accounts, trained booth staff to tag each lead with buying stage and solution interest, and enforced same day sync into the CRM with clear ownership between marketing and sales. Over a 90 day window, they saw that only about 40 percent of show leads became marketing qualified, but those qualified leads converted into opportunities at almost twice the rate of non event leads.
Measurement discipline extends beyond the event itself: Dutch teams that win on trade show ROI treat every show as a structured experiment with defined hypotheses and metrics. They track show leads by segment, compare sales cycles for event sourced opportunities versus other channels, and analyse which conversations at the booth correlate with higher deal values. In that context, a smaller booth with a sharper qualification script and rigorous follow up often delivers a better return investment than a larger stand optimised for spectacle.
Pre show, on site, and post show: the three phases that make or break ROI
Trade show ROI in Dutch B2B markets is largely decided before anyone steps onto the exhibition floor. Pre show planning determines whether your booth traffic consists of random visitors or a curated flow of target accounts who already recognise your brand. That is why top exhibitors in the Netherlands now allocate a significant share of show investment to account based invitations, meeting scheduling, and content tailored to specific buying committees.
On site, the focus shifts from attracting attention to qualifying intent, with booth design serving as a tool for orchestrating conversations rather than a static branding exercise. A well structured exhibit at the RAI will separate quick demos from deep dive discussions, ensuring that high value prospects are routed to senior sales or product experts while lighter leads are handled efficiently by SDRs. Every interaction is logged with clear metrics on role, buying stage, and next step, so that the post show machine has the data it needs to prioritise follow up.
The real test comes in the two weeks after the event, when most programmes lose the thread and let show ROI evaporate. Dutch teams that outperform treat the post show period as a time boxed campaign with strict service level agreements for first touch, multi channel cadences, and clear handovers between marketing and sales. For a detailed operational checklist covering pre show preparation, on site execution, and post show follow up tailored to Dutch exhibitors, specialised local guides provide step by step frameworks that align every phase with measurable pipeline outcomes.
Reporting trade show ROI to Dutch leadership: narratives that secure next year’s budget
When you walk into a Dutch executive meeting to defend next year’s trade show calendar, the story cannot hinge on how busy the booth felt. Leadership teams in the Netherlands expect a quantified view of show ROI that links each event to pipeline, revenue, and strategic positioning in key accounts. Your role as exhibitor or field marketing manager is to translate messy event data into a clean narrative that a CFO, CRO, and CMO can all interrogate.
A robust post show report now starts with a simple table that mirrors the ROI formula used earlier: total investment, total show leads, number of qualified leads, opportunities created, pipeline value, and closed revenue over a defined measurement window. It then compares cost per qualified lead and win rates for trade show sourced opportunities against other channels such as digital demand generation or partner referrals, highlighting where events accelerate sales cycles or unlock accounts that were previously stagnant. Dutch CFOs respond well to scenarios that show how reallocating budget from low performing shows to two or three high ROI events could lift overall pipeline efficiency without increasing total spend.
The most credible Dutch teams also acknowledge where programmes underperform and specify which metrics will change before the next exhibit. They might commit to tightening lead qualification criteria, improving CRM integration, or enforcing stricter follow up SLAs to reduce leakage in the long term funnel. In the end, the events that keep their line in the budget are not the ones with the flashiest stands, but the ones that can prove they consistently put the right buying committees in the room and move them meaningfully closer to a signed contract.
Key figures on Dutch trade show ROI and lead performance
- Dutch B2B exhibitors typically invest around 40 000 euros per trade show, which means even modest improvements in conversion from leads to opportunities can unlock hundreds of thousands of euros in additional pipeline over a single season.
- Roughly 70 percent of exhibitors report that they struggle to quantify trade show ROI, based on internal audits of CRM usage and post event reporting, indicating that competitive advantage now lies less in booth size and more in measurement capability and CRM discipline.
- Typical B2B sales cycles after a trade show contact last around 90 to 180 days, so measuring ROI only in the immediate post show period systematically underestimates the long term value of event sourced opportunities.
- Global benchmarks suggest that well executed trade show programmes can return between three and five times the initial investment in pipeline value, with some best in class cases reporting more than USD 20 in pipeline for every USD 1 spent when lead quality and follow up are tightly managed.
- Studies comparing acquisition channels show that average cost per lead at trade shows is around USD 112, significantly lower than the roughly USD 259 associated with traditional field sales calls, which reinforces the economic case for events when lead management is executed properly.
FAQ: trade show ROI for Dutch B2B exhibitors
How should Dutch B2B teams calculate trade show ROI in practice ?
Most Dutch exhibitors calculate trade show ROI by dividing the total pipeline value attributed to the event by the total investment, including show cost, booth design, travel, staffing, and marketing campaigns. They track both sourced opportunities that originate at the event and influenced deals that progress significantly after meetings on site. This approach provides a more accurate view than simply comparing revenue to stand fees, especially when sales cycles extend beyond 90 days.
What measurement window is realistic for Dutch B2B sales cycles ?
For complex B2B deals in the Netherlands, a measurement window of 90 to 180 days after the event usually aligns with typical sales cycles. Shorter windows tend to miss opportunities that mature slowly, especially in enterprise or public sector contexts. Many teams therefore report interim pipeline ROI at 90 days and update closed revenue figures later, using the same attribution logic for every event.
Why are badge scans and booth traffic poor indicators of ROI ?
Badge scans and raw booth traffic measure activity, not commercial impact, because they mix casual visitors with serious buyers. Dutch teams that focus on qualified leads, opportunity creation, and win rates gain a much clearer picture of whether an event is worth repeating. High traffic with low conversion usually signals weak targeting, poor qualification, or ineffective follow up.
What benchmarks should Dutch exhibitors use for cost per qualified lead ?
While numbers vary by sector, many Dutch B2B teams aim for a cost per qualified lead at trade shows that is significantly lower than field sales visits and competitive with digital acquisition. Given global data around USD 112 per lead at events, local teams often target similar or slightly higher figures for qualified leads, depending on deal size. The key is to track this metric consistently across shows and cut events that sit far above the portfolio average.
How can I present trade show ROI credibly to a Dutch CFO ?
A credible ROI report for a Dutch CFO combines a clear formula, transparent assumptions, and comparisons with alternative uses of budget. It should show total investment, pipeline generated, cost per qualified lead, and differences in sales cycles and win rates between event sourced and non event deals. Presenting scenarios for reallocating spend from low performing shows to higher ROI events often resonates strongly with finance leaders, especially when supported by CRM data and documented follow up processes.